

Visualizing Cannabis Cash Flow: Cash Dashboard Basics
In 2018, the hemp industry rejoiced when the Hemp Farming Act officially removed hemp from the list of Schedule 1 controlled substances. In 2019, accountants in the industry grinned from ear-to-ear as strict bank regulations on the industry were relaxed. At last, more and more banks continue to open their doors to us and are finally working closely with the hemp and CBD market.
I'm sure we don't have to go into the details about the benefits of banking in cannabis. Above all, it is simply safer for everyone in the industry and for data-driven professions such as accountants, it is an absolute godsend to have a simple bank statement. The celebration wouldn't last long for most however; as many turned their minds to the obvious follow up question: now what? How can I use my cash data to work for me? How do I more effectively manage my business and its cash position now that I don't have to jump an impossible hurdle just to get a bank account?
A cash flow dashboard is a common tool used in the treasury department of most organizations. A properly built cash dashboard offers real time insight into the cash position of your cannabis business. While this article is mainly centered around hemp and CBD companies, it is not impossible for THC companies to produce one as well, so long as they have a trusted custodian of their funds such as a state bank or credit union. The three primary benefits of setting up a cash dashboard are:
1. Visual cues give management clear indication of cash trends and outliers.
2. Cash activity can be segmented between operating, investing and financing activities.
3. Ability to be broken out by product/geographical lines.
If a picture is worth one thousand words, then a dashboard must be worth at least one million. Check out the below example of a cash dashboard for XYZ company and their cash activity in 2019. This is meant to represent a mid-sized CBD manufacturer.
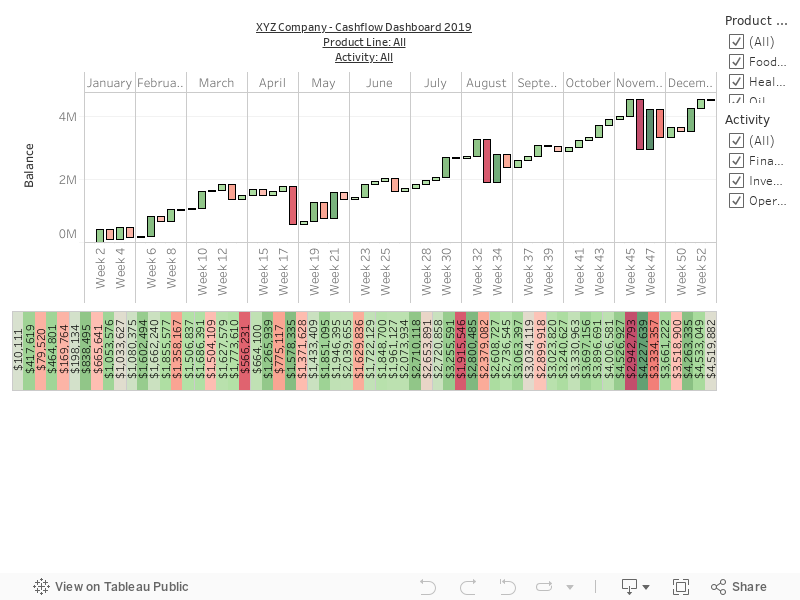
Take a few minutes to tinker with the above report. The functionality allows you to:
· Click on any bar to view the specific transactions that impacted cash that week.
· View cash activity based on cash flow statement activities.
· View cash activity based on product line.
Consider the amount of information that can be gleamed about XYZ Company from this simple presentation in one minute. In a handful of clicks we can determine:
· Their overall cash position for the year, what periods of 2019 they had cash shortfalls and what caused those large outlays
· The impact that financing and investing activity had on their cash position and the mix of debt and equity XYZ Company used to add new capital in 2019
· Which divisions were net cash positive and negative throughout the year; which required additional cash for equipment purchases.
Given the amount of data available, this is only scratching the surface. So in what specific ways can a cash flow dashboard help you better manage your cannabis company? Lets talk about some details regarding the 3 primary value adds of this report.
Cash Outliers & Trends
When your organization first starts using a cash dashboard, it will typically be used to analyze cash trends over the past year and current position. The excellent thing about a cash dashboard is it is both visual and real-time. By having an interactive feed of cash data, it becomes very easy to drill down into the details, allowing business decisions to be analyzed in real time. If you are not using something similar, how often do you review your cash account? Many companies may not realize it, but they are already assembling their own cash flow dashboard in a round about way - cobbling together different stories from different sources to try to understand their position. The cash flow dashboard makes it infinitely easier for a cannabis organization to take advantage of its cash data.
Cash outliers are the first thing most people notice when they first look at a cash dashboard. On the example linked above, there are three distinct weeks in 2019 that Company XYZ saw large cash outflows. Seasonality is also an important factor in the cannabis industry. For example, Massachusetts reported $1.46 million in marijuana bud sales the day after Thanksgiving. This cyclical behavior occurs all year round, with spikes in sales on CBD day, 4/20, the holiday season etc. As a cannabis company, it is in your best interest to understand how the spike in sales will impact you, as it will give you the ability to plan in advance. That could mean ramping up production, potentially ordering more materials, increasing employee hours and more.
When it comes to analyzing cash trends, a waterfall dashboard format is simply superior to a period analysis in a spreadsheet. The first benefit of a dashboard is your ability to zoom out, while not losing sight of the details. In the above example, we can see the cash activity for the entire year, what weeks provided the biggest inflows and outflows, all while keeping the year-to-date balance available within the view. The ability to drill down into the cash details of any given week is also a plus, as the business story that leads to the overall cash contribution can easily be constructed based on the details. The secondary benefit of a cash dashboard will come from the ability to slice and dice data. If your treasury data architecture allows it, you can easily develop a deep understanding of where your business gets its money from and where it spends it. In the above example, it seems the Oil product line is the primary cash cow while the Food & Beverage product line gets going.
With a real-time cash flow dashboard, data can be integrated directly from your financial database. If your organization uses an ERP such as Oracle, your cash dashboard can reflect real time data that is continuously refreshed. Many CBD organizations are not quite there yet - after-all, strict regulations on bank activity in the industry only recently became relaxed. You don't necessarily need a fancy ERP to create a powerful cash dashboard; it just may require some additional data manipulation in Excel or Access prior to creating the report.

Understanding Cash Activities
If your company has put together a statement of cash flows, you understand that cash activity can be broken out into one of three categories:
Operating - cash activity that will take place during the regular operations of your business. This will include cash inflows from product sales and cash outflows from producing the product as well as employee salaries.
Investing - cash activity from purchase of long term assets. This could mean investments into new property and machinery or even investments into other companies. An overall cash negative is not necessarily a bad thing here as it would indicate the company is putting cash towards new assets.
Financing - cash activity that affects liabilities and equity. This would be cash flows directly attributed to any loans, stock or dividends that your company has issues.
Including this breakout in the cash dashboard will be beneficial for several reasons. First, a regular review of your cash flow based on these activities will develop a habit in management, providing clarity into how the business is performing. Second, without the ability to show this breakout, a company's cash position can become misleading. Finally, the steps taken to categorize cash data and appropriately display the details on a dashboard in this manner likely means your organization has an organized approach to treasury and cash accounting.
A powerful habit will be formed by managers who regularly review their cash flow dashboard by cash activity. First, they will understand if their business is in a position of overall net cash inflow or outflow and what the driving factors are. Generally, the closer operating cash activity follows the pattern of overall cash flow, the more mature the company/division. Take a second to filter on just the operating activity in the above example - you'll notice that the general pattern is very similar to that of all activity. This is great - this means this organization is likely stable in its operations and was not overly dependent for cash on outside sources in 2019. The second benefit to review of cash flow by activity is scale. As your organization grows to larger heights, it will inevitably becoming impossible for one person to understand all the details behind cash transactions. Instilling an expectation of a regular review of the cash flow dashboard by management will ensure the entire organization stays educated on their cash position and what the impact is to the company.
In the current climate, many cannabis organizations are running on healthy margins but are bleeding cash in administrative costs. This is mainly due to complicated regulatory environments, high taxes and failing to realize economies of scale. As cannabis organizations continue to evolve to operate more efficiently and regulations continue to relax, these issues will subside. Until then, cash flow from the financing activity is crucial. Examining a cash flow dashboard without the ability to breakout activity can in fact be dangerous - what seems like an upward trend in cash could simply be the result of many injections of capital from outside forces and a bloated balance sheet not reflecting the company's ability to pull in a profit.
In order to create a breakout of cash activity, the data used to put together the dashboard must be correctly allocated. A decent amount of this can be automated - for example, most cash from sales will follow a standard pattern for appearing on your bank account, raw materials likely come from an approved list of vendors and as do bank loans and equity raises. Unfortunately, not all activity can be automated, as one-time transactions such as a sale of equipment will have to be accounted for. Even though there is some manual effort to maintain this categorized cash flow by activity, don't be mistaken - if your company produces a Statement of Cash Flows, you are already doing it.

Cash Activity by Product/Geography
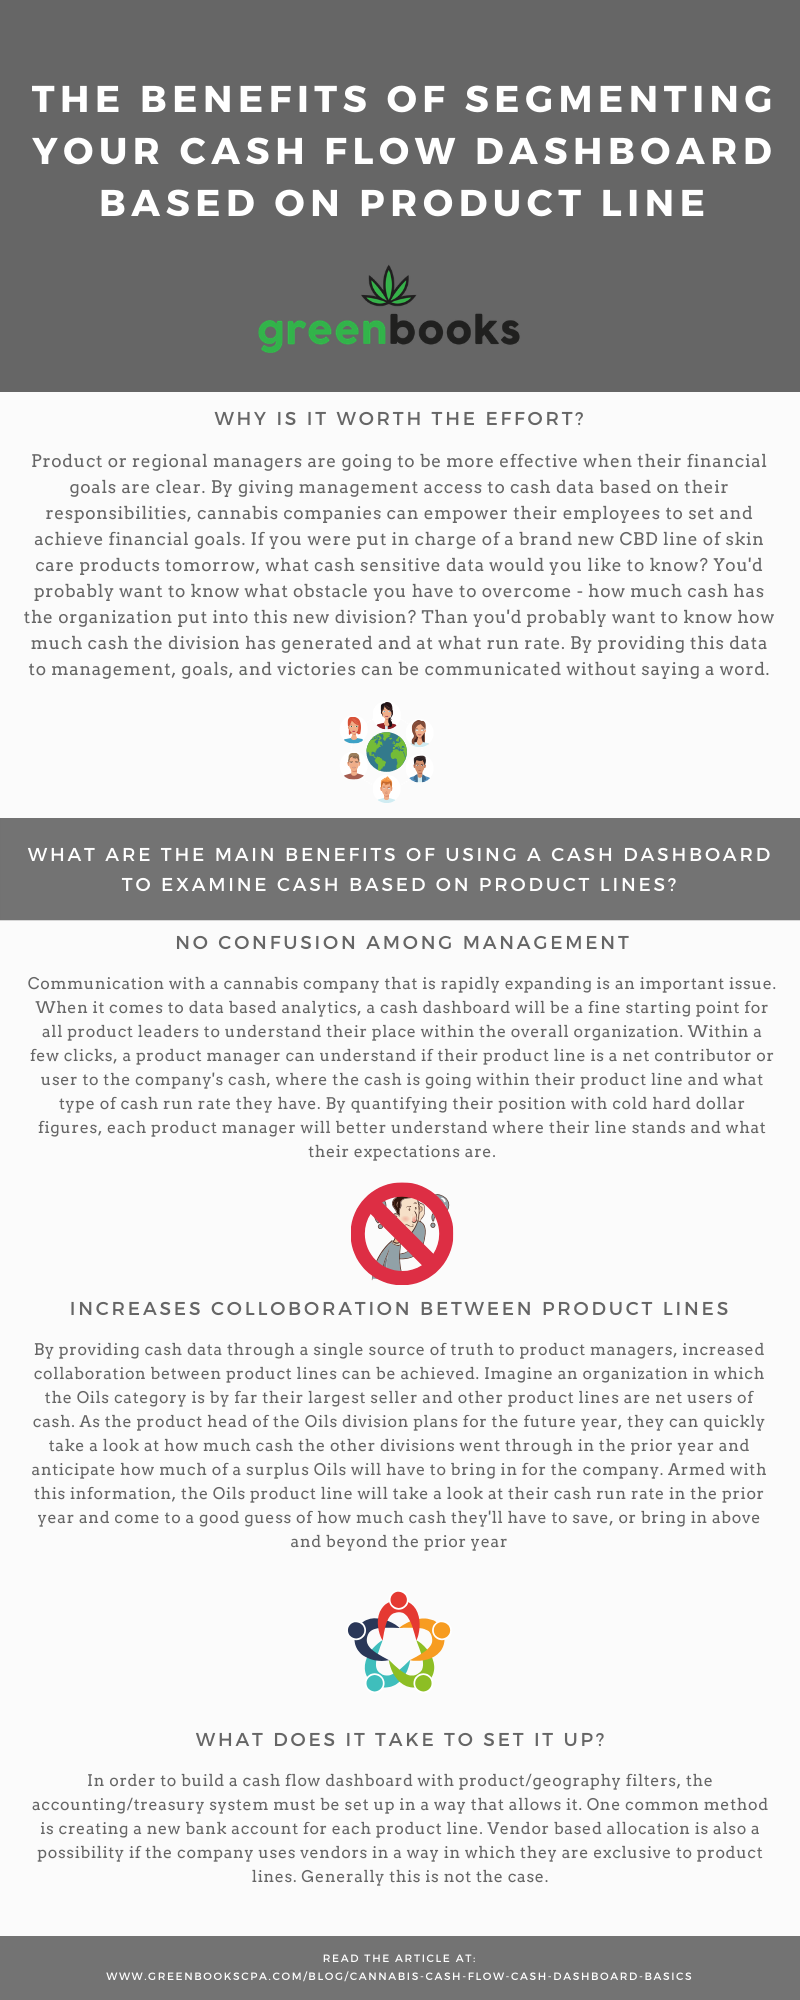
For organizations that produce many different lines of products or operate in different geographic spaces, it is important to also understand cash flow along these lines. The primary reason for this is that your company has likely broke out management responsibilities along these lines. By offering a single cash dashboard that integrates these business segments, all management can have a single source of truth, without lengthy, tedious accounting reconciliations. Its also true that management tends to perform better when their goal/target is clearly defined. A cash flow dashboard specific to their responsibilities can go a long way to help that definition.
Cash activity by product lines give management a high level understanding of which divisions or product lines are really pulling their weight versus which are being invested in for future growth. Quantifying this using real cash figures can be an eye opener for some organizations. As we mentioned above, the closer a division's operating cash flow chart matches its overall cash flow chart, the more mature that business segment is. For newer product lines, one should expect a more volatile cash position, as cash is being injected from new investors or cash is flowing out to purchase the necessary infrastructure. If you are a product or regional manager, cash data can provide invaluable points of reference, whether it be for how tight you need to be with expenses or how much you need to increase your sales channel.
If you are a smaller or even mid-sized cannabis company, you may feel it unnecessary to segregate cash by business division or even activity type. After-all, you know when you purchase a large piece of equipment or when you take a bank loan right? One of the beauties of the cash flow dashboard is it eliminates confusion among management as to cash inflows/outflows. With the detail readily available, there is seldom communication issues regarding a specific divisions cash position. Its important for your business to consider processes and communications when it comes to scale as well. The faster the cash dashboard can become a staple in driving accountability in your organization, the more likely your organization will increase efficiency in a timely manner.
In order to create a cash flow dashboard that includes product or geography distinctions, your treasury architecture must be set up in a way to do so. This could mean a few possibilities including segregating bank accounts or vendors along these lines. In the above example, XYZ company has a total of 9 bank accounts, each with its own purpose and segregated along product lines.
Building a scale-able cash dashboard for the cannabis industry is not an easy task. If requires intimate knowledge of the business, down to vendor level detail, as well as deep understanding of the IT, accounting and treasury systems in the background. If you are interested in some help setting one up, contact us and we can be a huge asset to you.
This is part 1 of our articles related to cash flow dashboards in the cannabis industry. In part 2, we will take a look at how to make the cash data work for you with cash forecasting analytics. In part 3, we will look to wrap up the full cash picture by adding in some Accounts Receivable and Accounts Payable detail. Make sure to subscribe and share if you found this article helpful!